


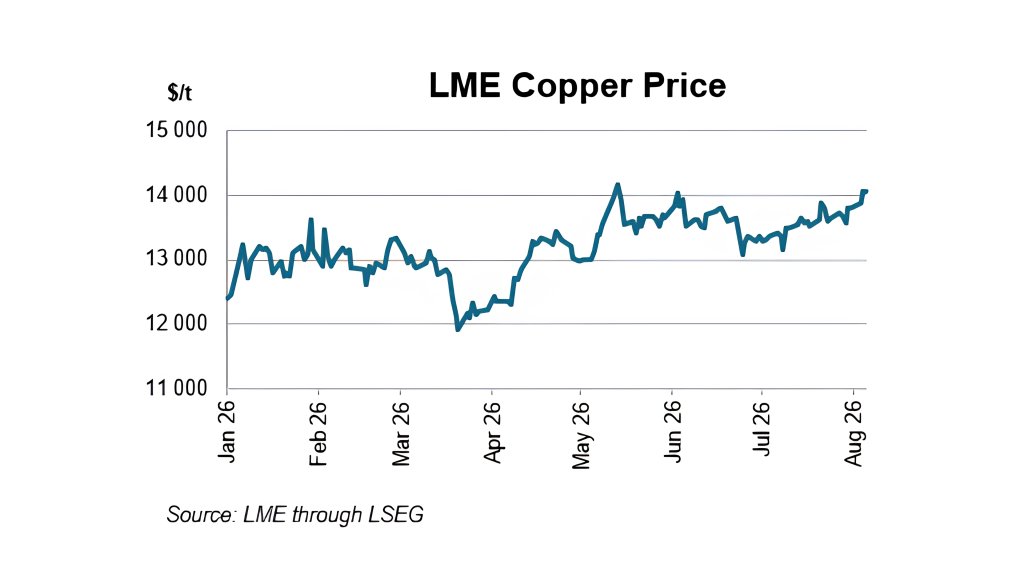
Copper prices surged above $14 000/t, the highest level since early June (see graph below), as declining inventories outside the US and persistent supply disruptions keeps the market tight as demand also remains robust.
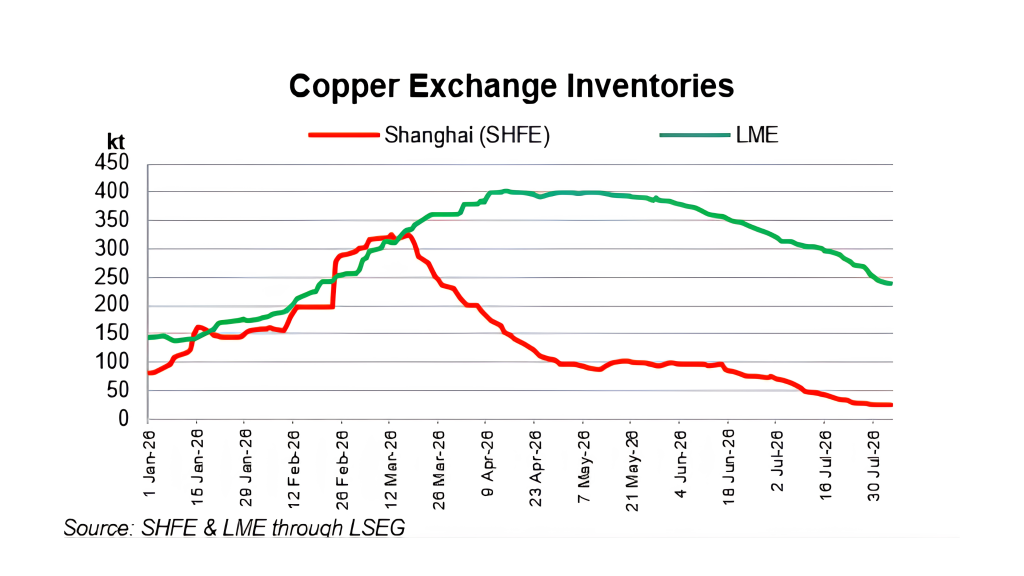
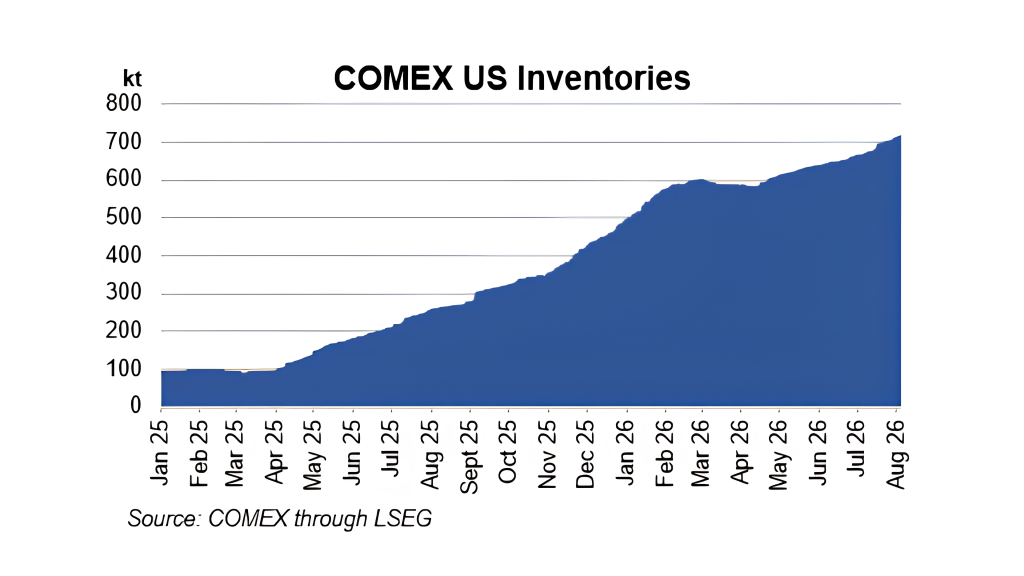
LME stocks and Shanghai inventories have continued to trend lower (see 1st graph), as shipments continue to be pulled into US warehouses ahead of potential new tariffs on refined copper imports; potential tariffs have created a strong US premium over LME prices and lifted COMEX warehouse inventories by 44% since the start of 2026 (2nd graph) – a decision on the tariffs were due at the end of June, but no announcement has been made yet.
Weather-related supply disruptions at several mines in top producer Chile disrupting operations at several mines have tightened the market further: Lundin Mining suspended operations at Caserones after heavy snowfall damaged power infrastructure (restoration of power is expected in the coming weeks, which will allow for a gradual restart of operations); Antofagasta temporarily paused mining and processing at Los Pelambres; Codelco halted activity at sites including El Teniente. The storms also disrupted Candelaria mine operations briefly, though the site has since returned to full capacity.
Supply issues extend beyond Chile. Ivanhoe’s Kamoa Kakula copper smelter in the DRC, the largest in Africa, operated at only about 60% of capacity since mid-February as it continues ramp-up from flooding in May last year; Ivanhoe has trimmed full-year guidance to 290-310kt, while full ramp-up is now targeted only for 2028.
Furthermore, Freeport-McMoRan’s Grasberg mine in Indonesia has also only partially recovered after force majeure was declared in September 2025 following a landslide that blocked mine access, with Freeport McMoRan’s 2nd quarter 2026 production improved from the 1st quarter as mine began phased restart and ramp-up – still, full capacity is still not expected until end-2027.
1st Half 2026 results from major producers Rio Tinto, Glencore and Anglo American highlighted improved output versus first half of 2025, even if volumes were still below the second half of 2025 (see table below).
| Production (kt) | 1H2026 | 2H2025 | 1H2025 | 1H2026 vs 2H2025 | 1H2026 vs 1H2025 | 2026 guidance (kt) |
| Rio Tinto (consolidated basis) | 442 | 445 | 438 | -0.7% | 0.8% | 800-870 |
| Glencore | 397 | 508 | 344 | -21.8% | 15.4% | 810-870 |
| Anglo American | 344 | 353 | 342 | -2.5% | 0.5% | 700-760 |
Higher copper prices have also lifted revenue across major producers (see table below) from copper assets, also contributing to increased underlying earnings led by copper divisions.
| Copper Revenue ($mn) | 1H2026 | 2H2025 | 1H2025 | 1H2026 vs 2H2025 | 1H2026 vs 1H2025 |
| Rio Tinto | 8 622 | 7 521 | 6 208 | 14.6% | 38.9% |
| Glencore | 8 140 | 7 270 | 4 325 | 12.0% | 88.2% |
| Anglo American | 4 923 | 4 456 | 3 666 | 10.5% | 34.3% |
Meanwhile, copper demand stayed firm as the global shift toward electrification continues, with additional support from spending on data centres and renewable-energy infrastructure. Latest half year results also underscore how copper demand is being reinforced by electrification and data-centre buildout.
Copper remains in a classic market squeeze: demand is being supported by the electrification and AI build-out, while supply is being constrained by lower grades at ageing mines, Chilean weather disruptions, limited mine supply growth and falling exchange inventories. The result is elevated prices in a tight and volatile market.
For more on the outlook for Copper; see our Copper forecasts.
Compiler: Dina Alleluya (dina@afriforesight.com)